
The BOARD OF GRADUATE STUDIES beg leave to report to the Council as follows: This report covers
| (a) | business of the Board of Graduate Studies conducted during the academical year 2006-07 in response to external bodies, recommendations concerning policy matters, and changes to the portfolio of graduate courses; |
| (b) | a statistical section covering:
|
The Board also publishes an Admissions Report which shows applications, offers, and admissions data relating to students commencing their study at the beginning of the Michaelmas Term of each year; in the subsequent Annual Report these data are updated to include students who commence their studies during the Lent and Easter Terms.
The Economic and Social Research Council (ESRC) undertook a review of the '1 + 3' pattern of research degrees.
The Arts and Humanities Research Council (AHRC) reviewed their existing student-led competition and decided to replace the student-driven competition with a 'block grant' system; changes will be implemented in 2008. The Board consulted the Degree Committees concerned and their responses were fed into an institutional response from the University. Responsibility for managing the payment of AHRC studentships will be devolved to universities from October 2007 (although no provision has been made for administrative costs): the burden of this will fall on the Board's Studentships Office.The AHRC rejected an appeal by one Faculty against a decision that they would be unable to submit applications in the 2007 and 2008 competitions due to low submission rates; and gave notice to two others that they would also be blacklisted if their results fell below the threshold set by the AHRC.
The Board welcomed the announcement from the Arts and Humanities Research Council of their participation in the scheme from October 2007.
At a local level, progress was made both in terms of training 'credits' offered and in terms of the take-up by students; funding for non-Research Council students was also sought during the year. Colleges considered how they could contribute, for example by supplying training 'credits'. The Board noted that much of the TST money was devolved and TST activity at Cambridge was driven by 'bottom-up' initiatives. They agreed that it was important also to engage the University at a more central level.
The Board noted with pleasure that, including a one-off payment of £70,000 from the Engineering and Physical Sciences Research Council (EPSRC) to develop 'Entrepreneurship TST' for EPSRC-funded research students, the University would have received a total of £3.9m of TST funds by September 2007: that is, 7% of the total national funds distributed.
The Board participated in this survey of research experience hosted by Bristol Online Surveys, in which a substantial proportion of questions related to TST. The TST officer at the Board administered this in conjunction with TST officers at Staff Development. A third of eligible students took part at Cambridge, and their general response was very positive, with their experience either meeting or exceeding their original expectations of the research degree programme.
The General Board Review of Graduate Education was ongoing throughout the year. The Secretary of the Board was a member of the Review Panel. Issues addressed by the Review were discussed as appropriate by the Board of Graduate Studies and are covered in this Annual Report under the relevant headings.
The Board received the Second Report to the General Board and welcomed progress towards the formal recognition of a 'graduate school' in Biological and Medical and Veterinary Sciences. They noted that a central core of knowledge and expertise at the Board of Graduate Studies would continue to be needed to provide quality assurance and both specialized and generic support across Schools.
The Board welcomed the change of name from 'Graduate School of Biological, Medical and Veterinary Sciences'.
The Board reviewed the introduction of new plagiarism procedures in Lent 2006 and agreed that although improvements had been made, further progress was needed. They suggested a warning notice; more effective induction; and a re-examination of the nature and level of penalties.
After a successful trial of plagiarism detection software, endorsed by the Board, it was agreed to recommend that a licence for the software be bought for the University, with a financial contribution from the Board's budget. Several issues arising from the use of such software, including concerns from Cambridge University Students Union (CUSU), were discussed, and guidelines on the use of the software were recommended.
The Board condemned the setting up of essay banks such as 'Oxbridge Essays' and issued a strong statement to this effect, aimed at those who might supply as well as those who might be tempted to use such a service. Consultations were ongoing with the University Advocate and Proctors, and with Oxford University, as to how any system of penalties might work.
In May 2007 the University held its first Plagiarism Awareness Day. The Day was organized by the Boards of Examinations and Graduate Studies in collaboration with CUSU and the Graduate Union with the aim of raising awareness of plagiarism and good academic practice amongst staff and students. It was intended to make this an annual event. A Plagiarism Working Group, including representation from the Board, was set up to examine these issues further.
The Board strongly supported a proposal for a single central office for dealing with student complaints, appeals, and other matters concerning academic integrity and discipline. This service would require legal advisers and would co-ordinate and oversee a framework of university review bodies (as now) to provide independent review. The powers and responsibilities of these in relation to the Boards of Examinations and Graduate Studies and other bodies would need to be clearly established. A comparative review of the various regulations would be needed.
The Board agreed that the establishment of such a service would be a major project and gave its support to this being set up as soon as possible.
The Board issued its first Code of Practice for Research Degrees to all research students and their supervisors. Work was begun on a version for graduate courses with significant taught elements with a view to issuing it in Michaelmas 2007.
The Board supported a proposal by the Faculty of Divinity to remove the option of submitting a specially composed thesis for the Doctor of Divinity (D.D.) Degree.
The Board supported a proposal by the Faculty of Music to amend the Guide for Applicants for the Doctor of Music (Mus.D.) Degree.
The Board clarified their intention from 2007-08 of ending backdating of the Ph.D. to include the M.Phil. year. The primary motivation behind this change was to recognize that most Ph.Ds. take longer than two further years after a Master's year. The ending of backdating would alleviate pressure on the students involved and improve submission rates (see also Fees, below).
The Board agreed to revise the Guides to both candidates and Examiners/Assessors to clarify the criteria for the degree and the nature of the examination for the degree. It was further agreed to formulate a coversheet for Assessors, incorporating a checklist of the criteria for proceeding to the examination and allowing the Assessor to provide additional brief feedback to be conveyed verbatim to an unsuccessful candidate.
The Board supported a proposal for a collaborative Ph.D. whereby graduates would spend two years in both Cambridge and Singapore studying according to Cambridge regulations for the Ph.D. Degree.
The Faculty of History does not admit candidates to the C.P.G.S. at the outset but awards the certificate as an exit qualification for candidates who have marginally failed the M.Phil. It also permits transfer to this qualification from the Ph.D. or M.Phil. at any point. Following on a letter from the Faculty, the Board commended this approach to all Faculties.
Fifteen institutions of varying size have 'NUI' status, that is they can take research students officially registered for a research degree of the University of Cambridge but carrying out their research under the remit of a Research Council or major charitable Trust. This year the five-yearly review of the scheme, including an invitation to existing NUIs to consider formally renewing their relationship with the University, was begun. The MRC Epidemiology Unit was granted non-University institution status.
Following on a request from a candidate to study for a part-time research degree while resident in China, the Board recommended that the rules for part-time research be revised to set limits on the extent to which candidates could pursue the degree without personal engagement in the Cambridge research community. Data showing the extent of the scheme are presented in the table below:
| Part-time students admitted | Total no of Departments registered | Total no of Colleges registered | |
| 2003-04 | 19 | 32 | 21 |
| 2004-05 | 26 | 38 | 26 |
| 2005-06 | 42 | 43 | 28 |
| 2006-07 | 31 | 45 | 29 |
Word limits: the Board approved amended word limits for theses for the Ph.D. and M.Litt. in International Studies and the Ph.D. in Oriental Studies.
Procedures for consideration of degree results: the Board agreed to consider Ph.D. results outside main meetings in short meetings to be arranged according to demand, in order to ease the pressure on the approval of other degrees at their October meetings. The first such meeting was held in August 2007.
The Board continued its consideration of the University's portfolio of Masters courses, and put forward proposals based on the purposes and learning outcomes of the various degrees. It was suggested that the M.Litt./M.Sc. and the M.Phil. by research only be amalgamated, and that a new degree of M.Res., full- or part-time, be introduced for former M.Phil. and M.St. courses which were more research-based than taught. Discussion on both these suggestions is ongoing.
The Board examined the costing template for new M.Phils. to see how it might be made clearer. It was agreed to amend both the costing template and the M.Phil. proposal template to provide further information to users.
The Board considered a proposal from Judge Business School to establish a new degree of Master of Finance from October 2008, which would focus on post-experience training for finance specialists and command a premium fee. They saw no objection in principle and having asked for more information on certain points recommended that the proposal go ahead. They agreed that a revision of Statute B, III to facilitate the creation of new degrees without recourse to Privy Council would be most welcome. This recommendation was subsequently incorporated into the recommendations of the General Board Review into Graduate Education (see above).
New courses introduced, or approved:
Courses rescinded, or approved for withdrawal:
Courses for which changes to the Special Regulations were approved:
Change of classification for HEFCE:
The Board recommended increases in the rates of M.Phil. Examiners' fees, which were subsequently incorporated into the General Board review of payments made to all Examiners and Assessors. As part of the new arrangements, the separate fee for conducting an oral examination was dropped and subsumed into increased flat-rate payments for examining and/or thesis examining.
The Board agreed to extend the payment of the supervision fee to supervisors of students in the writing-up period (i.e. terms 10-12 for the full-time Ph.D. and terms 16-21 for the part-time degree). A nominal fee for Advisors was also agreed.
Supervisor training: the Board received data on the availability of induction for supervisors and attendance at such sessions and sought to expand the programme in view of the likely increase in demand following publication of the Code of Practice. They further agreed to discuss with Staff Development the possibility of supporting training for post-docs who are required to carry out day-to-day supervisory duties under the 'Roberts' programme.
Meanwhile, attendance at the eight Lent seminars for Ph.D. supervisors increased from an average of 6 participants in 2006 to an average of 9 participants in 2007, with better representation from Arts and Humanities subjects than in previous years. The induction day for new supervisors of postgraduate students, held in November, was attended by 25 people (as compared to 17 in 2005).
The number of online applications increased to 26% for 2006 entry, compared to 17% for 2005 entry. The Board agreed not to re-open the question of charging for paper applications.
A problem occurred in the assignment of candidates under the CamSIS College distribution model which had the effect of reducing the number of candidates for all-female Colleges. The Board's admissions staff manually redistributed women applicants to redress the balance and the CamSIS team rapidly corrected the problem. The Board recommended that the Colleges review the CamSIS College allocation system.
Following on representations from some Faculties and Colleges that candidates were being accepted with inadequate language skills, the Board agreed that, where a candidate was below the minimum in both English language and academic results, no application for special consideration would be entertained.
The Board supported the introduction of a small charge for in-sessional training, and thought it reasonable that Faculties contribute to the cost.
For the first time this Annual Report is able to include the following disability information (figures relate to students beginning their course in the 2006-07 academical year):
| Number declaring a disability | % of whole cohort | |
| Applicants | 124 | 1.2 |
| Received conditional offer | 108 | 2.6 |
| Received confirmed offer | 70 | 2.9 |
The Board approved changes to the constitutions of the Earth Sciences and Geography, Modern and Medieval Languages, and Oriental Studies Degree Committees.
The Board were glad to respond to this review, noting particularly the current confusion as to the relative powers and responsibilities of ICE, the Board, and the Degree Committees. They made several suggestions regarding remedial training in basic study skills, progress reporting, and the systems of degree approval; but concluded overall that ICE played a valuable role in the provision of part-time masters' study.
The report to the Council and the General Board of the Council for Lifelong Learning, June 2007
The Board spent a considerable amount of time over the year discussing Graduate Student fee structures. Three issues in particular were addressed:
In the event the Board agreed, for its part, that a 'Fee for course' model would address all these issues. Discussions are ongoing.
With the agreement of the Trusts, the Board agreed to increase the estimate of the basic cost-of-living requirement by 6% for 2008-09, thereby completing the agreed increase over the past three years.
In January the University agreed that a special staff fee, set at one-third the current home/EU fee, be charged to members of staff undertaking research degrees. The Board received several requests for refunds of fees already paid. It was decided that in general fees should be refunded only to students who were currently still paying fees so that refunds could be adjusted from future fee payments.
Following on the University decision in 2005 that in principle differential fees for M.Phil. programmes offered within the University might be charged, Judge Business School proposed that premium fees be applied to M.Phils. in Technology Policy, Management, and Finance. The Board had no objection in principle; however, they noted the tendency for the proliferation of small variations in fees and recommended that a small number of premium fee bands should be established into which any applications to charge premium fees could be fitted. The Board could see no justification for creating a continuum of fees; indeed this would be utterly unworkable in CamSIS and a constant source of error and confusion to applicants, staff, and students.
In the light of this, the Board proposed that the fee for overseas students on the M.Phil. in Economics should be brought down to match the M.Phil. in Finance premium rate.
Dr Nichola Tooke, Head of Graduate Records and Examinations, took maternity leave from July 2007 and was replaced by Mr Mark Smith. Mrs Louise Burton, Head of Admissions, left the Board in May 2007 and was replaced by Dr Litsa Biggs. In September 2007 Dr Laurie Friday, Secretary of the Board, left the Board to take up a position in the Graduate School of Life Sciences.
The data reported here refer only to those applicants, students, and courses for whom the Board of Graduate Studies is the admitting authority and do not include, for example, candidates for the M.B.A., M.Ed., P.G.C.E., and certain diplomas.
Application figures were down 2.8% on last year, continuing the trend of the last couple of years. Within this, EU applications rose by over 10%, whereas overseas applications declined by 6% and home applications by nearly 2% (some comfort can be drawn from the fact that the rate of decline in home applications had reduced from last year, when it topped 10%). Male/female application numbers reflected the totals in each case.
Within these overall totals, applications for M.Phil. courses reduced by 2.5% over last year, although again there was a slight increase in EU applicants. But applications for research courses recovered a little (2.8%) from last year's five-year low - a 16.5% increase in EU applications and a 5% increase in home applications masking a further fall in research applications from overseas.
Applications for other, taught, postgraduate courses (Chart 1d) fell by 13% compared to 2005-06. In contrast to last year, applications from overseas candidates fell markedly (22%) offset by an increase in applications from home (3%) and EU (6%) candidates. However, these percentages relate to much smaller numbers: over 6,000 applications for M.Phils., 3,400 for research degrees, and only 1,200 for other postgraduate courses.
The total number of offers for admission under the jurisdiction of the Board, and offers of admission to 'other postgraduate courses' were reported for the first time in 2004 and the most recent figures are set out in Tables 2a and 2d respectively. Overall the number of offers has declined by 5.7% since last year, although there was an increase in offers to EU applicants. In percentage terms, the figures show that around 40% of applicants received an offer in both 2004 and 2005; this reduced slightly to 39% in 2006.
Offers for 2006 for the M.Phil. Degree were slightly (8%) down from 2005 (Table 2b) although, again, offers to EU candidates had increased slightly. The main decrease was in offers to home applicants (15.5% lower than in 2005).
Overall, offers for research courses were much as last year (Table 2c). However, offers to overseas students continued to decline from a high of around 1,040 offers in 2001-03 to 688 for 2006, a reduction of over 33%. As a percentage of applications, this was a drop from 49% of overseas applicants receiving offers for 2001 to 34% of overseas applicants receiving offers for 2006.
Offers for other taught postgraduate courses (Table 2d) fell from 512 to 417. Here, a 25% drop in offers to overseas candidates and a 6% drop in offers to home candidates masked an 18% rise in offers to EU candidates.
Of the total number of offers made, about half are confirmed each year as candidates meet the conditions set; this proportion (the 'take-up rate') is influenced by many factors, such as availability of funding and national and international contingencies. The rate has increased steadily over the last six years, and overall is now at nearly 60% (Table 3), and slightly more than this for research courses.
The distribution of new entrants among the M.Phil. courses is shown in Table 4a. The numbers of M.Phil. candidates varies markedly between courses and between disciplines and Schools. There are also considerable differences between Schools in the balance between UK, EU, and overseas candidates, although overall the number of overseas M.Phil. students is about half the total.
The distribution of new entrants for all graduate courses among the 25 Degree Committees is shown in Table 4b.
Annual figures for the proportion of new entrants by School (below) show little change from last year except for a 1% fall in the proportion of Arts and Humanities students, compensated for by a similar rise in the proportion of Clinical Medicine students.
| Entry in academic year beginning (%) | ||||
|---|---|---|---|---|
| School | 2003 | 2004 | 2005 | 2006 |
| Arts & Humanities | 15.9 | 16.1 | 17.7 | 16.2 |
| Humanities & Social Sciences | 30.9 | 32.7 | 31.7 | 31.7 |
| Physical Sciences | 17.0 | 16.2 | 15.3 | 15.2 |
| Biological Sciences | 13.2 | 10.5 | 10.4 | 10.9 |
| Clinical Medicine | 5.2 | 4.5 | 5.3 | 6.1 |
| Technology | 17.9 | 20.0 | 19.6 | 19.9 |
Table 4c gives the same information for 2006 as the above table, but also shows the distribution between the Schools of new entrants in each of the three categories home, EU, and overseas.
The overall numbers of new entrants in 2006 was down slightly on 2005 (Table 4d), although again there was an increase in EU entrants. Interestingly the reduction in the number of women entrants (1.3%) was not as great as that of men (2.7%). No difficulties were reported in placing candidates in Colleges.
The distribution of new entrants among Colleges is shown in Table 4e.
In 2006 nearly a fifth of all new graduate students were previously at the University of Cambridge. The numbers of graduates of other UK universities was reduced from 2005's exceptional figure of 954 (which had been an increase of 59% on the previous year) to 765, still a high figure in comparison with the previous ten years (Table 4f).
The numbers of graduate students on the Board of Graduate Studies' register at December 2006, and the number of these in residence (that is, excluding those having leave to work away or writing up) are shown, disaggregated by type of qualification, sex, and fee status, in Table 5a.
The distribution of registered graduate students on the register among the Departments and Faculties in December 2006 is shown in Table 5b.
Historical data on the numbers of registered graduate students are shown in Table 5c. These reveal that, over the ten years from 1997 to 2006:
The proportion of women applying, offered admission, taking up their place, and in residence is shown in Table 5d.
The distribution of graduate students by College (December 2006) is shown in Table 5e.
The proportion of research students submitting their dissertation for examination for the Ph.D. by the end of their fourth year remained steady for the cohort starting in 2002 at 69% (Table 6a). These four-year submission data vary widely between Schools and there is considerable fluctuation between cohorts of students in some Schools (Table 6b). The numbers of candidates approved for degrees during the academical year 2006-07 are shown in Table 7 (figures up to 2004 are for the calendar years shown). The numbers of degrees awarded per annum are always fewer than the total number of candidates admitted in the relevant years because a proportion of entrants are not candidates for a degree, but for a diploma or certificate.
No candidates were approved for the Ph.D. Degree under the Special Regulations during the year.
The numbers of candidates not approved for the qualification sought during the academical year 2006-07 are shown in Table 8. There was no significant change from the 2005-06 figures.
During the period October 2006 - September 2007, the Board approved only eight Higher Doctorates: seven candidates for the Sc.D. Degree, and one for the LL.D. Degree.
In keeping with the rest of this Annual Report, figures are given for students taking up their studentships in the academical year 2006-07.
The Board were concerned at the loss of a quarter of the top-ranked candidates who, having been offered an ORS award for 2007, had withdrawn from the competition, many to take up fully funded places elsewhere. They noted that close co-operation with the Trusts would be needed to achieve the goal of early complete funding packages.
| Competition for ORS awards to be taken up in: | 2005 | 2006 |
| Nomination allocated to Cambridge | 130 | N/A |
| Number of awards made (centrally for 05) | 115 | 95 |
| Success rate | 89% | N/A |
In April 2004, the government announced the Dorothy Hodgkin Postgraduate Awards scheme (DHPA), which provides three-year full-cost studentships, each co-funded by a Research Council and an industrial partner, for research students from the developing world. Candidates have to qualify for the ORS. Awards to Cambridge students have been as follows:
| Students starting in | 2004 | 2005 | 2006 |
| No of awards | 13 | 10 | 5 |
Details of awards made by the Board's Committee on Grants for 2006 (with 2005 for comparison) are shown below:
| 2005 | 2006 | |
|---|---|---|
| Domestic Research Studentship | 17 of which 11 full awards, 3 fees awards, 1 shared with a College, and 2 others | 19 (13 full awards, 6 fees awards). 4 awards shared with Colleges |
| Millenium Scholarship | 1 | 5, of which 3 shared with Colleges |
| Allen Meek and Read; Le Bas awards (partial maintenance awards in 2005)* | 18 | 17 |
* From 2006 the value of the Allen Meek and Read, and the Le Bas scholarships was increased to £5,000.
During 2006-07, five new cases were considered. In one case the candidate accepted Faculty conditions for revision and resubmission; in another the candidate was allowed to continue with a strict plan of work. Of the three remaining cases, one candidate was offered an M.Sc.; and two cases were referred to the Degree Committee under Regulation 3. One of these cases is still under consideration and the Degree Committee found no reason to uphold the complaint of the other. Of two ongoing cases, one candidate accepted an M.Sc. Degree. The Review Committee dismissed the complaint of the other, but the candidate rejected this outcome.
| March 2008 | ||
| W. BROWN (Chairman) | L. R. R. GELSTHORPE | R. G. OSBORNE |
| W. ALLISON | J. HEAL | J. RUNDE |
| G. A. J. AMARATUNGA | C. R. HILEY | B. SAHAKIAN |
| M. G. BLAMIRE | K. A. LINDER | M. YOUNGER |
| G. M. W. COOK | L. SHIDAI LIU | |
1 'overall rate' includes disabled as well as able-bodied applicants.
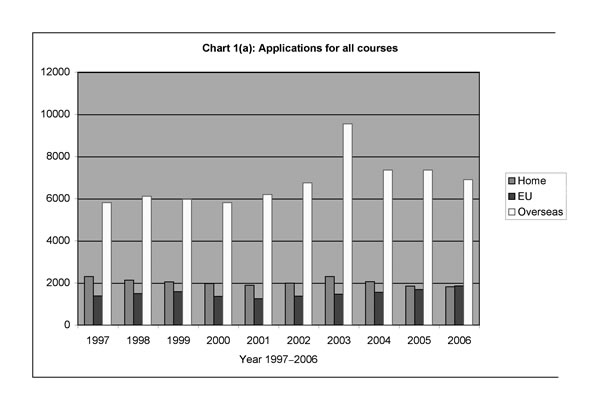
Table 1a: Total applications for all courses for which the Board is the admitting authority
| Home | EU | Overseas | Total | |||||||||
|---|---|---|---|---|---|---|---|---|---|---|---|---|
| Men | Women | Total | Men | Women | Total | Men | Women | Total | Men | Women | Total | |
| 1997 | 1504 | 799 | 2303 | 808 | 579 | 1387 | 3708 | 2098 | 5806 | 6020 | 3476 | 9496 |
| 1998 | 1347 | 788 | 2135 | 907 | 588 | 1495 | 3845 | 2270 | 6115 | 6099 | 3646 | 9745 |
| 1999 | 1345 | 708 | 2053 | 936 | 647 | 1583 | 3685 | 2283 | 5968 | 5966 | 3638 | 9604 |
| 2000 | 1249 | 723 | 1972 | 798 | 568 | 1366 | 3527 | 2278 | 5805 | 5574 | 3569 | 9143 |
| 2001 | 1167 | 725 | 1892 | 728 | 526 | 1254 | 3754 | 2440 | 6194 | 5649 | 3691 | 9340 |
| 2002 | 1277 | 713 | 1990 | 838 | 538 | 1376 | 3982 | 2767 | 6749 | 6097 | 4018 | 10115 |
| 2003 | 1464 | 836 | 2300 | 872 | 594 | 1466 | 5483 | 4060 | 9543 | 7819 | 5490 | 13309 |
| 2004 | 1280 | 779 | 2059 | 955 | 600 | 1555 | 4094 | 3257 | 7351 | 6329 | 4636 | 10965 |
| 2005 | 1144 | 705 | 1849 | 1000 | 682 | 1682 | 4062 | 3290 | 7352 | 6206 | 4677 | 10883 |
| 2006 | 1124 | 691 | 1815 | 1123 | 738 | 1861 | 3876 | 3023 | 6899 | 6123 | 4452 | 10575 |
Figures up to 2003 are for calendar years. From 2004, figures refer to applications for admission in the academic year starting in October of the year stated.
From 2004, figures relate to nationality rather than fee status.
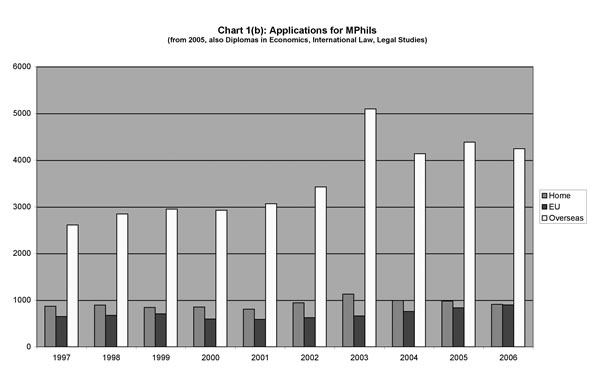
Table 1b: Applications for admission to one-year M.Phil. Degrees*
| Home | EU | Overseas | Total | |||||||||
|---|---|---|---|---|---|---|---|---|---|---|---|---|
| Men | Women | Total | Men | Women | Total | Men | Women | Total | Men | Women | Total | |
| 1997 | 559 | 309 | 868 | 351 | 300 | 651 | 1562 | 1047 | 2609 | 2472 | 1656 | 4128 |
| 1998 | 523 | 370 | 893 | 393 | 281 | 674 | 1649 | 1198 | 2847 | 2565 | 1849 | 4414 |
| 1999 | 515 | 330 | 845 | 393 | 315 | 708 | 1732 | 1218 | 2950 | 2640 | 1863 | 4503 |
| 2000 | 505 | 348 | 853 | 327 | 268 | 595 | 1706 | 1219 | 2925 | 2538 | 1835 | 4373 |
| 2001 | 462 | 344 | 806 | 313 | 274 | 587 | 1748 | 1318 | 3066 | 2523 | 1936 | 4459 |
| 2002 | 582 | 359 | 941 | 359 | 264 | 623 | 1900 | 1525 | 3425 | 2841 | 2148 | 4989 |
| 2003 | 694 | 434 | 1128 | 377 | 283 | 660 | 2789 | 2307 | 5096 | 3860 | 3024 | 6884 |
| 2004 | 601 | 393 | 994 | 424 | 333 | 757 | 2157 | 1980 | 4137 | 3182 | 2706 | 5888 |
| 2005 | 595 | 387 | 982 | 481 | 356 | 837 | 2280 | 2103 | 4383 | 3356 | 2846 | 6202 |
| 2006 | 538 | 370 | 908 | 515 | 384 | 899 | 2317 | 1925 | 4242 | 3370 | 2679 | 6049 |
Figures up to 2003 are for calendar years. From 2004, figures refer to applications for admission in the academic year starting in October of the year stated.
* From 2005, this also includes Graduate Diplomas (Economics, International Law, Legal Studies)
From 2004, figures relate to nationality rather than fee status.
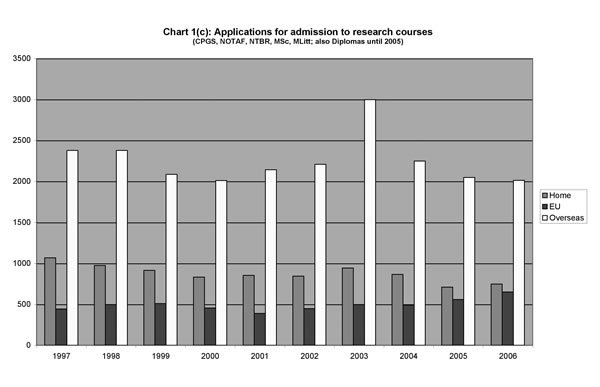
Table 1c: Applications for admission to research degree courses*
| Home | EU | Overseas | Total | |||||||||
|---|---|---|---|---|---|---|---|---|---|---|---|---|
| Men | Women | Total | Men | Women | Total | Men | Women | Total | Men | Women | Total | |
| 1997 | 689 | 378 | 1067 | 274 | 168 | 442 | 1645 | 733 | 2378 | 2608 | 1279 | 3887 |
| 1998 | 628 | 345 | 973 | 312 | 185 | 497 | 1655 | 722 | 2377 | 2595 | 1252 | 3847 |
| 1999 | 614 | 300 | 914 | 338 | 172 | 510 | 1430 | 655 | 2085 | 2382 | 1127 | 3509 |
| 2000 | 534 | 298 | 832 | 282 | 174 | 456 | 1329 | 682 | 2011 | 2145 | 1154 | 3299 |
| 2001 | 549 | 305 | 854 | 238 | 150 | 388 | 1434 | 709 | 2143 | 2221 | 1164 | 3385 |
| 2002 | 548 | 295 | 843 | 287 | 161 | 448 | 1475 | 734 | 2209 | 2310 | 1190 | 3500 |
| 2003 | 623 | 320 | 943 | 311 | 186 | 497 | 1948 | 1050 | 2998 | 2882 | 1556 | 4438 |
| 2004 | 545 | 319 | 864 | 334 | 157 | 491 | 1439 | 810 | 2249 | 2318 | 1286 | 3604 |
| 2005 | 443 | 267 | 710 | 359 | 199 | 558 | 1298 | 751 | 2049 | 2100 | 1217 | 3317 |
| 2006 | 482 | 264 | 746 | 406 | 245 | 651 | 1266 | 746 | 2012 | 2154 | 1255 | 3409 |
Figures up to 2003 are for calendar years. From 2004, figures refer to applications for the academic year starting in October of the year stated.
From 2004, figures relate to nationality rather than fee status.
Figures do not include applications from students continuing from a one-year graduate course.
* CPGS, NOTAF, NTBR, M.Sc., M.Litt. Until 2005 also included Graduate Diplomas (Economics, International Law, Legal Studies)
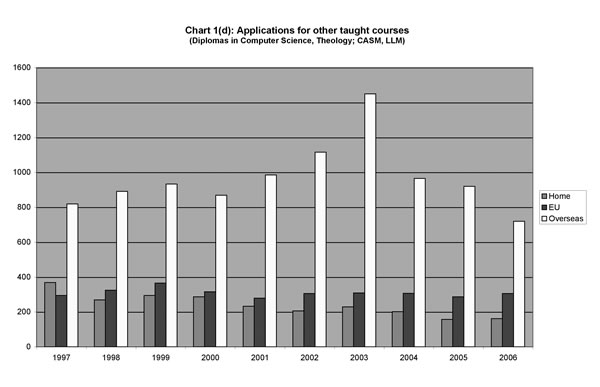
Table 1d: Applications for admission to other taught postgraduate courses under the jurisdiction of the Board*
| Home | EU | Overseas | Total | |||||||||
|---|---|---|---|---|---|---|---|---|---|---|---|---|
| Men | Women | Total | Men | Women | Total | Men | Women | Total | Men | Women | Total | |
| 1997 | 256 | 112 | 368 | 183 | 111 | 294 | 501 | 318 | 819 | 940 | 541 | 1481 |
| 1998 | 196 | 73 | 269 | 202 | 122 | 324 | 541 | 350 | 891 | 939 | 545 | 1484 |
| 1999 | 216 | 78 | 294 | 205 | 160 | 365 | 523 | 410 | 933 | 944 | 648 | 1592 |
| 2000 | 210 | 77 | 287 | 189 | 126 | 315 | 492 | 377 | 869 | 891 | 580 | 1471 |
| 2001 | 156 | 76 | 232 | 177 | 102 | 279 | 572 | 413 | 985 | 905 | 591 | 1496 |
| 2002 | 147 | 59 | 206 | 192 | 113 | 305 | 607 | 508 | 1115 | 946 | 680 | 1626 |
| 2003 | 147 | 82 | 229 | 184 | 125 | 309 | 746 | 703 | 1449 | 1077 | 910 | 1987 |
| 2004 | 134 | 67 | 201 | 197 | 110 | 307 | 498 | 467 | 965 | 829 | 644 | 1473 |
| 2005 | 106 | 51 | 157 | 160 | 127 | 287 | 484 | 436 | 920 | 750 | 614 | 1364 |
| 2006 | 106 | 56 | 162 | 198 | 107 | 305 | 367 | 352 | 719 | 671 | 515 | 1186 |
Figures up to 2003 are for calendar years. From 2004, figures refer to applications for the academic year starting in October of the year stated.
* Diplomas in Computer Science, Theology; CASM, LLM
From 2004, figures relate to nationality rather than fee status.
Table 2a: Offers of admisssions: all courses
| Home | EU | Overseas | Total | |||||||||
|---|---|---|---|---|---|---|---|---|---|---|---|---|
| Men | Women | Total | Men | Women | Total | Men | Women | Total | Men | Women | Total | |
| 2004 | 750 | 499 | 1249 | 459 | 299 | 758 | 1308 | 1057 | 2365 | 2517 | 1855 | 4372 |
| 2005 | 706 | 467 | 1173 | 468 | 298 | 766 | 1326 | 1120 | 2446 | 2500 | 1885 | 4385 |
| 2006 | 675 | 433 | 1108 | 507 | 333 | 840 | 1173 | 1009 | 2182 | 2355 | 1775 | 4130 |
Figures refer to offers for the academic year starting in October of the year stated.
Figures do not include offers to candidates wishing to continue after a one-year graduate course.
Table 2b: Offers of admission: one-year M.Phil. Degree courses*
| Home | EU | Overseas | Total | |||||||||
|---|---|---|---|---|---|---|---|---|---|---|---|---|
| Men | Women | Total | Men | Women | Total | Men | Women | Total | Men | Women | Total | |
| 1997 | 291 | 196 | 487 | 120 | 112 | 232 | 544 | 359 | 903 | 955 | 667 | 1622 |
| 1998 | 306 | 251 | 557 | 146 | 101 | 247 | 648 | 456 | 1104 | 1100 | 808 | 1908 |
| 1999 | 293 | 213 | 506 | 147 | 124 | 271 | 554 | 474 | 1028 | 994 | 811 | 1805 |
| 2000 | 267 | 220 | 487 | 131 | 132 | 263 | 504 | 437 | 941 | 902 | 789 | 1691 |
| 2001 | 282 | 217 | 499 | 155 | 129 | 284 | 628 | 574 | 1202 | 1065 | 920 | 1985 |
| 2002 | 317 | 219 | 536 | 160 | 126 | 286 | 652 | 567 | 1219 | 1129 | 912 | 2041 |
| 2003 | 334 | 239 | 573 | 138 | 113 | 251 | 643 | 612 | 1255 | 1115 | 964 | 2079 |
| 2004 | 325 | 252 | 577 | 176 | 153 | 329 | 584 | 597 | 1181 | 1085 | 1002 | 2087 |
| 2005 | 366 | 257 | 623 | 213 | 155 | 368 | 709 | 711 | 1420 | 1288 | 1123 | 2411 |
| 2006 | 303 | 223 | 526 | 212 | 164 | 376 | 645 | 660 | 1305 | 1160 | 1047 | 2207 |
Figures up to 2003 are for calendar years. From 2004, figures refer to offers for the academic year starting in October of the year stated.
* From 2005, this also includes Graduate Diplomas (Economics, International Law, Legal Studies).
Table 2c: Offers of admission for research degree courses*
| Home | EU | Overseas | Total | |||||||||
|---|---|---|---|---|---|---|---|---|---|---|---|---|
| Men | Women | Total | Men | Women | Total | Men | Women | Total | Men | Women | Total | |
| 1997 | 407 | 232 | 639 | 142 | 85 | 227 | 592 | 288 | 880 | 1141 | 605 | 1746 |
| 1998 | 396 | 221 | 617 | 164 | 95 | 259 | 672 | 294 | 966 | 1232 | 610 | 1842 |
| 1999 | 357 | 183 | 540 | 167 | 88 | 255 | 546 | 260 | 806 | 1070 | 531 | 1601 |
| 2000 | 342 | 198 | 540 | 175 | 97 | 272 | 537 | 260 | 797 | 1054 | 555 | 1609 |
| 2001 | 399 | 220 | 619 | 151 | 102 | 253 | 690 | 352 | 1042 | 1240 | 674 | 1914 |
| 2002 | 367 | 192 | 559 | 173 | 100 | 273 | 696 | 341 | 1037 | 1236 | 633 | 1869 |
| 2003 | 365 | 203 | 568 | 150 | 100 | 250 | 644 | 399 | 1043 | 1159 | 702 | 1861 |
| 2004 | 350 | 221 | 571 | 181 | 114 | 295 | 563 | 338 | 901 | 1094 | 673 | 1767 |
| 2005 | 280 | 186 | 466 | 166 | 99 | 265 | 453 | 278 | 731 | 899 | 563 | 1462 |
| 2006 | 298 | 181 | 479 | 177 | 122 | 299 | 416 | 272 | 688 | 891 | 575 | 1466 |
Figures up to 2003 are for calendar years. From 2004, figures refer to offers for the academic year starting in October of the year stated.
Figures do not include offers to candidates wishing to continue after a one-year graduate course
* CPGS, NOTAF, NTBR, M.Sc., M.Litt.; to 2004 also Graduate Diplomas (Economics, International Law, Legal Studies)
Table 2d: Offers of admission: other taught postgraduate courses* for which the Board is the admitting authority
| Home | EU | Overseas | Total | |||||||||
|---|---|---|---|---|---|---|---|---|---|---|---|---|
| Men | Women | Total | Men | Women | Total | Men | Women | Total | Men | Women | Total | |
| 2004 | 75 | 26 | 101 | 102 | 32 | 134 | 161 | 122 | 283 | 338 | 180 | 518 |
| 2005 | 60 | 24 | 84 | 89 | 44 | 133 | 164 | 131 | 295 | 313 | 199 | 512 |
| 2006 | 59 | 20 | 79 | 112 | 45 | 157 | 125 | 96 | 221 | 296 | 161 | 457 |
Figures refer to offers for the academic year starting in October of the year stated.
* Diplomas in Computer Science, Theology; CASM, LL.M.
Table 3: Take-up of offers (confirmed admissions as percentages of offers made)
| M.Phil* | Research** | Other | Overall | |||||||||||||
|---|---|---|---|---|---|---|---|---|---|---|---|---|---|---|---|---|
| Home | EU | Overseas | Total | Home | EU | Overseas | Total | Home | EU | Overseas | Total | Home | EU | Overseas | Total | |
| 2000 | 63 | 57 | 47 | 53 | 81 | 58 | 40 | 57 | 57 | 53 | 41 | 47 | 70 | 55 | 42 | 53 |
| 2001 | 63 | 51 | 45 | 50 | 71 | 57 | 36 | 50 | 47 | 58 | 42 | 47 | 61 | 56 | 36 | 46 |
| 2002 | 60 | 55 | 42 | 49 | 71 | 48 | 38 | 51 | 63 | 61 | 41 | 49 | 71 | 53 | 39 | 50 |
| 2003 | 65 | 55 | 45 | 52 | 72 | 58 | 41 | 52 | 65 | 54 | 41 | 50 | 69 | 57 | 40 | 51 |
| 2004 | 68 | 64 | 48 | 56 | 81 | 57 | 28 | 50 | 51 | 56 | 51 | 52 | 73 | 60 | 41 | 53 |
| 2005 | 66 | 55 | 50 | 55 | 85 | 71 | 47 | 63 | 49 | 66 | 39 | 48 | 72 | 63 | 48 | 57 |
| 2006 | 67 | 63 | 50 | 56 | 84 | 67 | 49 | 64 | 54 | 73 | 40 | 54 | 73 | 66 | 49 | 59 |
* from 2005, includes Diplomas in Economics, International Law, Legal Studies
** to 2004, includes Diplomas in Economics, International Law, Legal Studies
Table 4a: New entrants registered for M.Phil. Degree courses in 2006-07
| School and Course | Home | EU | Overseas | Total |
|---|---|---|---|---|
| School of Arts and Humanities | ||||
| American Literature | 4 | 2 | 1 | 7 |
| Anglo-Saxon, Norse, and Celtic | 4 | 0 | 5 | 9 |
| Chinese Studies | 4 | 1 | 3 | 8 |
| Classics | 13 | 9 | 17 | 39 |
| English and Applied Linguistics | 0 | 1 | 9 | 10 |
| English Studies | 11 | 1 | 7 | 19 |
| Environmental Design in Architecture | 1 | 1 | 0 | 2 |
| Ethnomusicology | 0 | 0 | 1 | 1 |
| European Literature and Culture | 15 | 4 | 7 | 26 |
| History of Art and Architecture | 7 | 2 | 6 | 15 |
| Linguistics | 7 | 7 | 6 | 20 |
| Medieval and Renaissance Literature | 10 | 1 | 10 | 21 |
| Musical Composition | 2 | 0 | 0 | 2 |
| Musicology | 1 | 1 | 4 | 6 |
| Oriental Studies | 3 | 1 | 6 | 10 |
| Philosophy | 10 | 5 | 5 | 20 |
| Russian Studies | 2 | 2 | 2 | 6 |
| Screen Media and Cultures | 6 | 4 | 5 | 15 |
| Theology and Religious Studies | 16 | 0 | 6 | 22 |
| SUBTOTAL | 116 | 42 | 100 | 258 |
| School of Humanities and Social Sciences | ||||
| Archaeological Science | 0 | 0 | 1 | 1 |
| Biological Anthropology | 3 | 1 | 4 | 8 |
| Biological Anthropological Science | 1 | 2 | 0 | 3 |
| Contemporary European Studies | 2 | 8 | 2 | 12 |
| Criminology | 2 | 0 | 2 | 4 |
| Criminological Research | 3 | 1 | 8 | 12 |
| Development Studies | 4 | 5 | 27 | 36 |
| Early Modern History | 6 | 1 | 2 | 9 |
| Economic and Social History | 2 | 1 | 3 | 6 |
| Economics | 19 | 15 | 19 | 53 |
| Education | 14 | 5 | 46 | 65 |
| Environmental Policy | 3 | 2 | 11 | 16 |
| Historical Studies | 16 | 2 | 6 | 24 |
| History and Philosophy of Science and Medicine | 5 | 1 | 13 | 19 |
| International Relations | 17 | 10 | 32 | 59 |
| International Studies | 1 | 1 | 1 | 3 |
| Land Economy: Option A | 1 | 1 | 2 | 4 |
| Land Economy: Option B | 2 | 1 | 9 | 12 |
| Latin-American Studies | 3 | 3 | 7 | 13 |
| Medieval History | 9 | 1 | 3 | 13 |
| Modern European History | 5 | 6 | 6 | 17 |
| Modern Society and Global Transformations | 3 | 5 | 7 | 15 |
| Planning, Growth, and Regeneration | 0 | 0 | 11 | 11 |
| Political Thought and Intellectual History | 4 | 2 | 13 | 19 |
| Real Estate Finance | 6 | 2 | 35 | 43 |
| Social Anthropological Analysis | 2 | 10 | 4 | 16 |
| Social Anthropological Research | 1 | 3 | 0 | 4 |
| Social and Development Psychology | 2 | 3 | 3 | 8 |
| World Archaeology | 7 | 2 | 12 | 21 |
| SUBTOTAL | 143 | 94 | 289 | 526 |
| School of the Physical Sciences | ||||
| Chemistry | 0 | 0 | 4 | 4 |
| Computational Biology | 4 | 7 | 20 | 31 |
| Earth Sciences | 0 | 1 | 2 | 3 |
| Environment and Development | 4 | 0 | 7 | 11 |
| Geographical Information Systems and Remote Sensing | 3 | 1 | 2 | 6 |
| Geographical Research | 4 | 0 | 0 | 4 |
| Materials Modelling | 1 | 1 | 1 | 3 |
| Micro and Nanotechnology | 3 | 2 | 14 | 19 |
| Physics | 2 | 5 | 2 | 9 |
| Polar Studies | 1 | 1 | 1 | 3 |
| Fluid Flow in Industry and Environment | 2 | 0 | 0 | 2 |
| Quaternary Science | 0 | 1 | 1 | 2 |
| Statistical Science | 3 | 6 | 7 | 16 |
| SUBTOTAL | 27 | 25 | 61 | 113 |
| School of the Biological Sciences | ||||
| Biological Science | 3 | 12 | 13 | 28 |
| Developmental Biology | 1 | 3 | 0 | 4 |
| Veterinary Science | 1 | 0 | 0 | 1 |
| SUBTOTAL | 5 | 15 | 13 | 33 |
| School of Clinical Medicine | ||||
| Epidemiology | 4 | 0 | 12 | 16 |
| Medical Sciences | 2 | 2 | 6 | 10 |
| Public Health | 5 | 0 | 6 | 11 |
| SUBTOTAL | 11 | 2 | 24 | 37 |
| School of Technology | ||||
| Advanced Chemical Engineering Practice | 0 | 0 | 13 | 13 |
| Bioscience Enterprise | 4 | 6 | 13 | 23 |
| Computer Speech, Text, and Internet Technology | 2 | 5 | 9 | 16 |
| Engineering | 3 | 5 | 10 | 18 |
| Engineering for Sustainable Development | 13 | 4 | 19 | 36 |
| Finance | 9 | 14 | 22 | 45 |
| Financial Research | 0 | 0 | 1 | 1 |
| Industrial Systems, Manufacture, and Management | 7 | 13 | 22 | 42 |
| Innovation, Strategy, and Organization | 3 | 2 | 9 | 14 |
| Management | 7 | 5 | 27 | 39 |
| Management Research | 0 | 4 | 3 | 7 |
| Management Science | 0 | 3 | 5 | 8 |
| Technology Policy | 1 | 12 | 15 | 28 |
| SUBTOTAL | 49 | 73 | 168 | 290 |
| GRAND TOTAL | 351 | 251 | 655 | 1257 |
Numbers include candidates registered for the M.Phil. 'in the first instance' as part of a research degree programme.
Table 4b: New entrants for all courses for which the Board is the admitting authority, by Degree Committee 2006-07
| Home | EU | Overseas | Total | |
|---|---|---|---|---|
| School of Arts and Humanities | ||||
| Architecture and History of Art | 16 | 4 | 13 | 33 |
| Classics | 19 | 13 | 22 | 54 |
| Divinity | 26 | 4 | 14 | 44 |
| English | 57 | 9 | 41 | 107 |
| Modern and Medieval Languages | 48 | 23 | 24 | 95 |
| Music | 4 | 3 | 8 | 15 |
| Oriental Studies | 10 | 3 | 19 | 32 |
| Philosophy | 13 | 7 | 7 | 27 |
| SUBTOTAL FOR SCHOOL | 193 | 66 | 148 | 407 |
| School of the Humanities and Social Sciences | ||||
| Archaeology and Anthropology | 23 | 32 | 38 | 93 |
| Economics | 31 | 23 | 27 | 81 |
| Education | 23 | 8 | 61 | 92 |
| History | 71 | 28 | 52 | 151 |
| History and Philosophy of Science and Medicine | 12 | 2 | 16 | 30 |
| International Studies | 29 | 42 | 61 | 132 |
| Land Economy | 18 | 15 | 89 | 122 |
| Law | 15 | 11 | 23 | 49 |
| Social and Political Sciences | 12 | 15 | 19 | 46 |
| SUBTOTAL FOR SCHOOL | 234 | 176 | 386 | 796 |
| School of the Physical Sciences | ||||
| Earth Sciences and Geography | 37 | 5 | 17 | 59 |
| Mathematics | 38 | 38 | 37 | 113 |
| Physics and Chemistry | 102 | 37 | 71 | 210 |
| SUBTOTAL FOR SCHOOL | 177 | 80 | 125 | 382 |
| School of the Biological Sciences | ||||
| Biology | 106 | 65 | 103 | 274 |
| SUBTOTAL FOR SCHOOL | 106 | 65 | 103 | 274 |
| School of Clinical Medicine | ||||
| Clinical Medicine and Clinical Veterinary Medicine | 65 | 57 | 32 | 154 |
| SUBTOTAL FOR SCHOOL | 65 | 57 | 32 | 154 |
| School of Technology | ||||
| Computer Laboratory | 12 | 12 | 21 | 45 |
| Engineering | 71 | 55 | 173 | 299 |
| Business and Management | 22 | 50 | 85 | 157 |
| SUBTOTAL FOR SCHOOL | 105 | 117 | 279 | 501 |
| TOTAL FOR ALL SCHOOLS | 880 | 561 | 1073 | 2514 |
Table 4c: Fee status of new entrants for courses under the jurisdiction of the Board, by School, 2006-07
| Home | EU | Overseas | Total | |
|---|---|---|---|---|
| School of Arts and Humanities | 22.0% | 11.8% | 13.8% | 16.2% |
| School of the Humanities and Social Sciences | 26.6% | 31.4% | 36.0% | 31.7% |
| School of the Physical Sciences | 20.1% | 14.3% | 11.6% | 15.2% |
| School of the Biological Sciences | 12.0% | 11.6% | 9.6% | 10.9% |
| School of Clinical Medicine | 7.4% | 10.2% | 3.0% | 6.1% |
| School of Technology | 11.9% | 20.9% | 26.0% | 19.9% |
| 100% | 100% | 100% | 100% |
Table 4d: New entrants: all qualifications for which the Board is the admitting authority, by sex and fee status
| Home | EU | Overseas | Total | |||||||||
|---|---|---|---|---|---|---|---|---|---|---|---|---|
| Men | Women | Total | Men | Women | Total | Men | Women | Total | Men | Women | Total | |
| 1997 | 444 | 255 | 699 | 132 | 107 | 239 | 393 | 269 | 662 | 969 | 631 | 1600 |
| 1998 | 427 | 277 | 704 | 152 | 90 | 242 | 441 | 291 | 732 | 1020 | 658 | 1678 |
| 1999 | 327 | 215 | 542 | 167 | 118 | 285 | 368 | 312 | 680 | 862 | 645 | 1507 |
| 2000 | 427 | 296 | 723 | 165 | 130 | 295 | 418 | 311 | 729 | 1010 | 737 | 1747 |
| 2001 | 411 | 277 | 688 | 140 | 105 | 245 | 450 | 369 | 819 | 1001 | 751 | 1752 |
| 2002 | 481 | 300 | 781 | 174 | 123 | 297 | 507 | 375 | 882 | 1162 | 798 | 1960 |
| 2003 | 475 | 296 | 771 | 146 | 129 | 275 | 500 | 396 | 896 | 1121 | 821 | 1942 |
| 2004 | 546 | 362 | 908 | 277 | 178 | 455 | 478 | 482 | 960 | 1301 | 1022 | 2323 |
| 2005 | 532 | 397 | 929 | 272 | 199 | 471 | 622 | 545 | 1167 | 1426 | 1141 | 2567 |
| 2006 | 514 | 367 | 881 | 301 | 218 | 519 | 573 | 541 | 1114 | 1388 | 1126 | 2514 |
Figures up to 2003 are for calendar years. From 2004, figures refer to new entrants in the academic year starting in October of the year stated.
Figures do not include students continuing after a one-year graduate course.
Table 4e: Distribution among Colleges of new Graduate Students by sex and fee status, Michaelmas Term 2006
| Research | Other courses | ||||||||||||||||||
| Home | EU | Overseas | Total | Home | EU | Overseas | Total | ||||||||||||
| Men | Women | Men | Women | Men | Women | Men | Women | All | Men | Women | Men | Women | Men | Women | Men | Women | All | Total all courses | |
| Christ's College | 12 | 0 | 1 | 0 | 4 | 2 | 17 | 2 | 19 | 7 | 5 | 2 | 0 | 7 | 3 | 16 | 8 | 24 | 43 |
| Churchill College | 3 | 4 | 6 | 1 | 18 | 6 | 27 | 11 | 38 | 4 | 2 | 9 | 4 | 19 | 24 | 32 | 30 | 62 | 100 |
| Clare College | 13 | 18 | 7 | 3 | 6 | 7 | 26 | 28 | 54 | 5 | 9 | 2 | 3 | 8 | 6 | 15 | 18 | 33 | 87 |
| Clare Hall | 5 | 2 | 9 | 6 | 12 | 7 | 26 | 15 | 41 | 3 | 4 | 4 | 2 | 16 | 13 | 23 | 19 | 42 | 83 |
| Corpus Christi College | 14 | 10 | 4 | 4 | 2 | 4 | 20 | 18 | 38 | 5 | 1 | 3 | 1 | 2 | 7 | 10 | 9 | 19 | 57 |
| Darwin College | 28 | 29 | 9 | 14 | 19 | 16 | 56 | 59 | 115 | 15 | 16 | 11 | 18 | 27 | 29 | 53 | 63 | 116 | 231 |
| Downing College | 11 | 7 | 6 | 5 | 9 | 5 | 26 | 17 | 43 | 8 | 6 | 7 | 3 | 12 | 7 | 27 | 16 | 43 | 86 |
| Emmanuel College | 7 | 7 | 2 | 4 | 5 | 7 | 14 | 18 | 32 | 5 | 3 | 1 | 1 | 6 | 7 | 12 | 11 | 23 | 55 |
| Fitzwilliam College | 6 | 2 | 6 | 3 | 11 | 5 | 23 | 10 | 33 | 8 | 3 | 12 | 5 | 19 | 17 | 39 | 25 | 64 | 97 |
| Girton College | 5 | 2 | 1 | 4 | 6 | 1 | 12 | 7 | 19 | 5 | 3 | 7 | 0 | 18 | 10 | 30 | 13 | 43 | 62 |
| Gonville and Caius | |||||||||||||||||||
| College | 18 | 9 | 7 | 4 | 7 | 4 | 32 | 17 | 49 | 1 | 7 | 0 | 0 | 1 | 4 | 2 | 11 | 13 | 62 |
| Homerton College | 5 | 1 | 0 | 2 | 4 | 5 | 9 | 8 | 17 | 8 | 9 | 5 | 4 | 8 | 6 | 21 | 19 | 40 | 57 |
| Hughes Hall | 7 | 5 | 15 | 3 | 14 | 14 | 36 | 22 | 58 | 14 | 2 | 9 | 8 | 33 | 24 | 56 | 34 | 90 | 148 |
| Jesus College | 19 | 8 | 4 | 3 | 4 | 5 | 27 | 16 | 43 | 13 | 10 | 1 | 2 | 7 | 4 | 21 | 16 | 37 | 80 |
| King's College | 11 | 9 | 3 | 2 | 7 | 5 | 21 | 16 | 37 | 10 | 8 | 1 | 1 | 11 | 13 | 22 | 22 | 44 | 81 |
| Lucy Cavendish College | - | 4 | - | 3 | - | 6 | - | 13 | 13 | - | 2 | - | 5 | - | 14 | - | 21 | 21 | 34 |
| Magdalene College | 6 | 3 | 5 | 4 | 6 | 3 | 17 | 10 | 27 | 4 | 3 | 1 | 0 | 4 | 4 | 9 | 7 | 16 | 43 |
| New Hall | - | 15 | - | 3 | - | 9 | - | 27 | 27 | - | 8 | - | 2 | - | 13 | - | 23 | 23 | 50 |
| Newnham College | - | 4 | - | 1 | - | 10 | - | 15 | 15 | - | 6 | - | 1 | - | 8 | - | 15 | 15 | 30 |
| Pembroke College | 9 | 6 | 6 | 4 | 9 | 5 | 24 | 15 | 39 | 5 | 4 | 4 | 3 | 7 | 5 | 16 | 12 | 28 | 67 |
| Peterhouse | 12 | 8 | 3 | 0 | 3 | 1 | 18 | 9 | 27 | 6 | 0 | 0 | 0 | 4 | 3 | 10 | 3 | 13 | 40 |
| Queens' College | 15 | 7 | 7 | 3 | 10 | 7 | 32 | 17 | 49 | 11 | 7 | 6 | 4 | 19 | 22 | 36 | 33 | 69 | 118 |
| Robinson College | 7 | 3 | 0 | 0 | 3 | 1 | 10 | 4 | 14 | 2 | 2 | 0 | 2 | 4 | 4 | 6 | 8 | 14 | 28 |
| St Catharine's College | 11 | 8 | 1 | 3 | 4 | 6 | 16 | 17 | 33 | 6 | 2 | 2 | 2 | 6 | 9 | 14 | 13 | 27 | 60 |
| St Edmund's College | 6 | 3 | 3 | 4 | 14 | 10 | 23 | 17 | 40 | 9 | 6 | 7 | 8 | 18 | 12 | 34 | 26 | 60 | 100 |
| St John's College | 9 | 7 | 11 | 9 | 11 | 12 | 31 | 28 | 59 | 8 | 5 | 8 | 5 | 10 | 10 | 26 | 20 | 46 | 105 |
| Selwyn College | 10 | 3 | 7 | 1 | 4 | 4 | 21 | 8 | 29 | 5 | 1 | 0 | 3 | 4 | 4 | 9 | 8 | 17 | 46 |
| Sidney Sussex College | 6 | 2 | 4 | 2 | 3 | 9 | 13 | 13 | 26 | 5 | 4 | 10 | 6 | 5 | 6 | 20 | 16 | 36 | 62 |
| Trinity College | 23 | 10 | 6 | 4 | 15 | 12 | 44 | 26 | 70 | 8 | 4 | 2 | 2 | 7 | 8 | 17 | 14 | 31 | 101 |
| Trinity Hall | 9 | 14 | 4 | 7 | 16 | 7 | 29 | 28 | 57 | 10 | 3 | 4 | 4 | 8 | 12 | 22 | 19 | 41 | 98 |
| Wolfson College | 15 | 12 | 20 | 8 | 21 | 8 | 56 | 28 | 84 | 16 | 6 | 20 | 11 | 36 | 30 | 72 | 47 | 119 | 203 |
| TOTAL FOR ALL | |||||||||||||||||||
| COLLEGES | 302 | 222 | 157 | 114 | 247 | 203 | 706 | 539 | 1245 | 199 | 146 | 136 | 110 | 319 | 335 | 670 | 599 | 1269 | 2514 |
Table 4f: Previous institutions of new Graduate Students
| Cambridge University | Other UK universities | Overseas institutions | Non-Graduates | ||||||||||
| Men | Women | Total | Men | Women | Total | Men | Women | Total | Men | Women | Total | % of total from Cambridge | |
| 1997 | 204 | 89 | 293 | 304 | 214 | 518 | 461 | 327 | 788 | 0 | 1 | 1 | 18.3 |
| 1998 | 159 | 95 | 254 | 353 | 220 | 573 | 505 | 343 | 848 | 3 | 0 | 3 | 15.1 |
| 1999 | 81 | 53 | 134 | 314 | 212 | 526 | 465 | 380 | 845 | 2 | 0 | 2 | 8.9 |
| 2000 | 184 | 117 | 301 | 317 | 230 | 547 | 502 | 383 | 885 | 5 | 7 | 12 | 17.2 |
| 2001 | 191 | 107 | 298 | 318 | 221 | 539 | 487 | 423 | 910 | 6 | 2 | 8 | 17.1 |
| 2002 | 236 | 123 | 359 | 334 | 218 | 552 | 581 | 452 | 1033 | 12 | 6 | 18 | 18.3 |
| 2003 | 204 | 116 | 320 | 345 | 254 | 599 | 560 | 447 | 1007 | 12 | 4 | 16 | 16.5 |
| 2004 | 241 | 158 | 399 | 346 | 254 | 600 | 589 | 515 | 1104 | 7 | 9 | 16 | 18.8 |
| 2005 | 301 | 207 | 508 | 524 | 430 | 954 | 600 | 505 | 1105 | 24 | 12 | 36 | 19.7 |
| 2006 | 236 | 166 | 402 | 420 | 345 | 765 | 446 | 400 | 846 | 5 | 4 | 9 | 19.9 |
Table 5a: Qualifications for which Graduate Students are registered, academical year 2006-07
| Total | In Residence* | |||||||||||||||||
| Home | EU | Overseas | Total | Home | EU | Overseas | Total | |||||||||||
| Men | Women | Men | Women | Men | Women | Men | Women | All | Men | Women | Men | Women | Men | Women | Men | Women | All | |
| Ph.D. Degree | 1334 | 847 | 566 | 388 | 1113 | 748 | 3013 | 1983 | 4996 | 796 | 545 | 352 | 231 | 628 | 406 | 1776 | 1182 | 2958 |
| Eng.D. Degree | 1 | 0 | 0 | 0 | 0 | 0 | 1 | 0 | 1 | 1 | 0 | 0 | 0 | 0 | 0 | 1 | 0 | 1 |
| M.Sc. Degree | 5 | 3 | 1 | 3 | 9 | 5 | 15 | 11 | 26 | 3 | 3 | 1 | 2 | 5 | 4 | 9 | 9 | 18 |
| M.Litt. Degree | 0 | 3 | 0 | 3 | 6 | 3 | 6 | 9 | 15 | 0 | 2 | 0 | 0 | 3 | 1 | 3 | 3 | 6 |
| M.Phil. Degree | 309 | 209 | 183 | 148 | 481 | 504 | 973 | 861 | 1834 | 205 | 148 | 142 | 115 | 337 | 348 | 684 | 611 | 1295 |
| Diplomas | 6 | 2 | 3 | 3 | 4 | 2 | 13 | 7 | 20 | 6 | 2 | 3 | 2 | 2 | 2 | 11 | 6 | 17 |
| Certs. of Postgraduate | ||||||||||||||||||
| Studies | 15 | 10 | 3 | 3 | 12 | 3 | 30 | 16 | 46 | 12 | 9 | 2 | 3 | 10 | 2 | 24 | 14 | 38 |
| Not yet registered | 126 | 102 | 63 | 38 | 83 | 70 | 272 | 210 | 482 | 122 | 99 | 61 | 37 | 78 | 68 | 261 | 204 | 465 |
| Sought no qualification | 0 | 0 | 1 | 0 | 3 | 1 | 4 | 1 | 5 | 0 | 0 | 1 | 0 | 3 | 1 | 4 | 1 | 5 |
| TOTAL FOR ALL | ||||||||||||||||||
| QUALIFICATIONS | 1796 | 1176 | 820 | 586 | 1711 | 1336 | 4327 | 3098 | 7425 | 1145 | 808 | 562 | 390 | 1066 | 832 | 2773 | 2030 | 4803 |
* students who are 'within terms' and are not researching away from Cambridge
Table 5b: Distribution of Graduate Students in December 2006, by School, Faculty, and Department
| Home | EU | Overseas | Total | ||||||
| Men | Women | Men | Women | Men | Women | Men | Women | All | |
| School of Arts and Humanities | |||||||||
| Architecture and History of Art | |||||||||
| Architecture | 14 | 5 | 7 | 8 | 13 | 8 | 34 | 21 | 55 |
| History of Art | 6 | 14 | 5 | 2 | 4 | 9 | 15 | 25 | 40 |
| Total for Degree Committee | 20 | 19 | 12 | 10 | 17 | 17 | 49 | 46 | 95 |
| Classics | |||||||||
| Total for Degree Committee | 22 | 17 | 16 | 19 | 16 | 15 | 54 | 51 | 105 |
| Divinity | |||||||||
| Total for Degree Committee | 37 | 21 | 7 | 5 | 43 | 9 | 87 | 35 | 122 |
| English | |||||||||
| Anglo-Saxon, Norse, and Celtic | 8 | 11 | 4 | 3 | 5 | 8 | 17 | 22 | 39 |
| Research Centre for Applied Linguistics | 1 | 2 | 3 | 5 | 6 | 17 | 10 | 24 | 34 |
| English | 55 | 64 | 5 | 11 | 25 | 50 | 85 | 125 | 210 |
| Total for Degree Committee | 64 | 77 | 12 | 19 | 36 | 75 | 112 | 171 | 283 |
| Modern and Medieval Languages | |||||||||
| French | 5 | 14 | 2 | 9 | 2 | 5 | 9 | 28 | 37 |
| German | 3 | 4 | 6 | 5 | 0 | 2 | 9 | 11 | 20 |
| Italian | 6 | 10 | 2 | 4 | 1 | 3 | 9 | 17 | 26 |
| Linguistics | 7 | 10 | 8 | 8 | 5 | 8 | 20 | 26 | 46 |
| Other Languages | 0 | 0 | 1 | 2 | 0 | 0 | 1 | 2 | 3 |
| Slavonic Studies | 0 | 2 | 3 | 1 | 0 | 1 | 3 | 4 | 7 |
| Spanish and Portuguese | 1 | 9 | 0 | 2 | 2 | 0 | 3 | 11 | 14 |
| Modern and Medieval Languages | 11 | 12 | 3 | 8 | 5 | 9 | 19 | 29 | 48 |
| Total for Degree Committee | 33 | 61 | 25 | 39 | 15 | 28 | 73 | 128 | 201 |
| Music | |||||||||
| Total for Degree Committee | 16 | 12 | 6 | 5 | 15 | 7 | 37 | 24 | 61 |
| Oriental Studies | |||||||||
| Total for Degree Committee | 16 | 17 | 12 | 7 | 38 | 40 | 66 | 64 | 130 |
| Philosophy | |||||||||
| Total for Degree Committee | 16 | 3 | 8 | 3 | 11 | 3 | 35 | 9 | 44 |
| School of the Humanities and Social Sciences | |||||||||
| Archaeology and Anthropology | |||||||||
| Archaeology | 22 | 19 | 8 | 21 | 19 | 47 | 49 | 87 | 136 |
| Biological Anthropology | 10 | 13 | 3 | 10 | 8 | 14 | 21 | 37 | 58 |
| Social Anthropology | 14 | 17 | 20 | 21 | 14 | 25 | 48 | 63 | 111 |
| Total for Degree Committee | 46 | 49 | 31 | 52 | 41 | 86 | 118 | 187 | 305 |
| Economics and Politics | |||||||||
| Total for Degree Committee | 41 | 10 | 38 | 12 | 41 | 25 | 120 | 47 | 167 |
| Education | |||||||||
| Total for Degree Committee | 13 | 24 | 5 | 26 | 42 | 122 | 60 | 172 | 232 |
| History | |||||||||
| Total for Degree Committee | 124 | 57 | 43 | 22 | 67 | 65 | 234 | 144 | 378 |
| History and Philosophy of Science | |||||||||
| Total for Degree Committee | 21 | 10 | 1 | 4 | 19 | 14 | 41 | 28 | 69 |
| International Studies | |||||||||
| Centre for International Studies | 49 | 17 | 38 | 27 | 67 | 59 | 154 | 103 | 257 |
| Centre for Latin-American Studies | 0 | 4 | 1 | 2 | 0 | 7 | 1 | 13 | 14 |
| Total for Degree Committee | 49 | 21 | 39 | 29 | 67 | 66 | 155 | 116 | 271 |
| Land Economy | |||||||||
| Development Studies Committee | 12 | 6 | 13 | 3 | 54 | 57 | 79 | 66 | 145 |
| Land Economy | 1 | 3 | 2 | 3 | 8 | 20 | 11 | 26 | 37 |
| Total for Degree Committee | 13 | 9 | 15 | 6 | 62 | 77 | 90 | 92 | 182 |
| Law | |||||||||
| Institute of Criminology | 6 | 13 | 4 | 6 | 10 | 15 | 20 | 34 | 54 |
| Law | 19 | 10 | 18 | 10 | 25 | 18 | 62 | 38 | 100 |
| Total for Degree Committee | 25 | 23 | 22 | 16 | 35 | 33 | 82 | 72 | 154 |
| Social and Political Sciences | |||||||||
| Total for Degree Committee | 13 | 16 | 16 | 19 | 37 | 38 | 66 | 73 | 139 |
| School of the Physical Sciences | |||||||||
| Earth Sciences and Geography | |||||||||
| Earth Sciences | 41 | 27 | 1 | 0 | 10 | 11 | 52 | 38 | 90 |
| Geography | 26 | 28 | 9 | 7 | 21 | 31 | 56 | 66 | 122 |
| Scott Polar Research Institute | 5 | 3 | 4 | 3 | 4 | 6 | 13 | 12 | 25 |
| British Antarctic Survey | 1 | 0 | 0 | 0 | 0 | 0 | 1 | 0 | 1 |
| Total for Degree Committee | 73 | 58 | 14 | 10 | 35 | 48 | 122 | 116 | 238 |
| Mathematics | |||||||||
| Applied Mathematics and Theoretical Physics | 65 | 6 | 43 | 8 | 48 | 21 | 156 | 35 | 191 |
| Pure Mathematics and Mathematical Statistics | 37 | 9 | 18 | 12 | 25 | 10 | 80 | 31 | 111 |
| MRC Biostatistics Unit | 0 | 0 | 0 | 0 | 0 | 0 | 0 | 0 | 0 |
| Total for Degree Committee | 102 | 15 | 61 | 20 | 73 | 31 | 236 | 66 | 302 |
| Physics and Chemistry | |||||||||
| Institute of Astronomy | 23 | 10 | 6 | 1 | 8 | 7 | 37 | 18 | 55 |
| Chemistry | 143 | 63 | 38 | 20 | 36 | 35 | 217 | 118 | 335 |
| Materials Science and Metallurgy | 59 | 26 | 19 | 8 | 56 | 22 | 134 | 56 | 190 |
| Physics | 132 | 39 | 40 | 15 | 76 | 29 | 248 | 83 | 331 |
| IRC in Superconductivity | 0 | 0 | 0 | 0 | 0 | 0 | 0 | 0 | 0 |
| Total for Degree Committee | 357 | 138 | 103 | 44 | 176 | 93 | 636 | 275 | 911 |
| School of the Biological Sciences | |||||||||
| Biology | 0 | 0 | 0 | 0 | 2 | 0 | 2 | 0 | 2 |
| Anatomy | 0 | 0 | 0 | 0 | 0 | 0 | 0 | 0 | 0 |
| Biochemistry | 46 | 35 | 16 | 10 | 30 | 29 | 92 | 74 | 166 |
| Experimental Psychology | 8 | 13 | 11 | 3 | 10 | 11 | 29 | 27 | 56 |
| Genetics | 14 | 10 | 4 | 17 | 11 | 11 | 29 | 38 | 67 |
| Pathology | 32 | 40 | 5 | 12 | 8 | 15 | 45 | 67 | 112 |
| Pharmacology | 8 | 10 | 1 | 6 | 12 | 16 | 21 | 32 | 53 |
| Plant Sciences | 12 | 17 | 3 | 6 | 13 | 8 | 28 | 31 | 59 |
| Physiology | 1 | 0 | 0 | 1 | 0 | 0 | 1 | 1 | 2 |
| Zoology | 28 | 36 | 15 | 11 | 12 | 15 | 55 | 62 | 117 |
| Babraham Institute, BBSRC | 22 | 33 | 4 | 4 | 7 | 4 | 33 | 41 | 74 |
| MRC Cognition and Brain Sciences Unit | 6 | 8 | 2 | 3 | 2 | 3 | 10 | 14 | 24 |
| MRC Cancer Cells Unit | 0 | 0 | 0 | 0 | 0 | 0 | 0 | 0 | 0 |
| Dunn Human Nutrition Unit | 23 | 12 | 1 | 0 | 7 | 4 | 31 | 16 | 47 |
| European Bioinformatics Institute | 2 | 2 | 10 | 4 | 4 | 3 | 16 | 9 | 25 |
| MRC Resource Centre for Human Nutrition Research | 1 | 8 | 1 | 0 | 0 | 1 | 2 | 9 | 11 |
| Molecular Biology, MRC Laboratory | 25 | 18 | 12 | 12 | 16 | 10 | 53 | 40 | 93 |
| MRC Centre for Protein Engineering | 2 | 4 | 3 | 1 | 6 | 0 | 11 | 5 | 16 |
| The Sanger Centre | 10 | 9 | 10 | 5 | 11 | 12 | 31 | 26 | 57 |
| Physiology, Development, and Neuroscience | 28 | 25 | 10 | 8 | 16 | 23 | 54 | 56 | 110 |
| UK HGMP Resource Centre | 0 | 0 | 0 | 0 | 0 | 0 | 0 | 0 | 0 |
| Total for Degree Committee | 268 | 280 | 108 | 103 | 167 | 165 | 543 | 548 | 1091 |
| School of Clinical Medicine and Veterinary Medicine | |||||||||
| Clinical Biochemistry | 10 | 8 | 1 | 3 | 2 | 5 | 13 | 16 | 29 |
| Clinical Neurosciences | 11 | 10 | 6 | 4 | 9 | 6 | 26 | 20 | 46 |
| Clinical Pharmacology Unit | 3 | 8 | 0 | 2 | 0 | 0 | 3 | 10 | 13 |
| Haematology | 3 | 4 | 3 | 1 | 7 | 0 | 13 | 5 | 18 |
| Laboratory for Medicinal Chemistry | 0 | 0 | 0 | 0 | 1 | 0 | 1 | 0 | 1 |
| Medicine | 24 | 21 | 9 | 10 | 7 | 6 | 40 | 37 | 77 |
| MRC Cambridge Centre for Brain Repair | 3 | 4 | 0 | 7 | 3 | 2 | 6 | 13 | 19 |
| Medical Genetics | 3 | 9 | 1 | 2 | 5 | 4 | 9 | 15 | 24 |
| Obstetrics and Gynaecology | 2 | 1 | 0 | 1 | 1 | 4 | 3 | 6 | 9 |
| Oncology | 11 | 3 | 5 | 8 | 9 | 10 | 25 | 21 | 46 |
| Paediatrics | 1 | 0 | 1 | 0 | 0 | 0 | 2 | 0 | 2 |
| Psychiatry | 7 | 13 | 3 | 4 | 8 | 7 | 18 | 24 | 42 |
| Public Health and Primary Care | 3 | 6 | 0 | 1 | 10 | 9 | 13 | 16 | 29 |
| Radiology | 5 | 1 | 2 | 0 | 0 | 2 | 7 | 3 | 10 |
| Surgery | 10 | 3 | 4 | 1 | 4 | 4 | 18 | 8 | 26 |
| Clinical Medicine | 9 | 20 | 3 | 2 | 9 | 10 | 21 | 32 | 53 |
| Institute of Public Health | 2 | 1 | 0 | 2 | 2 | 1 | 4 | 4 | 8 |
| Animal Health Trust | 0 | 1 | 0 | 0 | 0 | 0 | 0 | 1 | 1 |
| Veterinary Medicine | 14 | 8 | 2 | 4 | 6 | 5 | 22 | 17 | 39 |
| Total for Degree Committee | 121 | 121 | 40 | 52 | 83 | 75 | 244 | 248 | 492 |
| School of Technology | |||||||||
| Computer Laboratory | 65 | 11 | 24 | 8 | 77 | 18 | 166 | 37 | 203 |
| Total for Degree Committee | 65 | 11 | 24 | 8 | 77 | 18 | 166 | 37 | 203 |
| Engineering | |||||||||
| Chemical Engineering | 41 | 10 | 12 | 4 | 39 | 19 | 92 | 33 | 125 |
| Institute of Biotechnology | 11 | 9 | 6 | 7 | 16 | 10 | 33 | 26 | 59 |
| Engineering | 179 | 37 | 101 | 25 | 370 | 104 | 650 | 166 | 816 |
| Total for Degree Committee | 231 | 56 | 119 | 36 | 425 | 133 | 775 | 225 | 1000 |
| Business and Management | 24 | 11 | 53 | 28 | 77 | 57 | 154 | 96 | 250 |
| Total for Degree Committee | 24 | 11 | 53 | 28 | 77 | 57 | 154 | 96 | 250 |
| TOTAL FOR ALL DEGREE COMMITTEES 2006 | 1810 | 1136 | 830 | 594 | 1715 | 1340 | 4355 | 3070 | 7425 |
Table 5c: Graduate Students on the register in December 2006, by sex and fee status
| Home | EU | Overseas | Total | % | ||||||
| Men | Women | Men | Women | Men | Women | Men | Women | All | Women | |
| 1997 | 1709 | 882 | 447 | 322 | 1198 | 760 | 3354 | 1964 | 5318 | 37 |
| 1998 | 1648 | 930 | 474 | 320 | 1243 | 806 | 3365 | 2056 | 5421 | 38 |
| 1999 | 1598 | 925 | 532 | 346 | 1196 | 858 | 3326 | 2129 | 5455 | 39 |
| 2000 | 1574 | 991 | 545 | 373 | 1250 | 864 | 3369 | 2228 | 5597 | 40 |
| 2001 | 1507 | 1029 | 557 | 387 | 1318 | 944 | 3382 | 2360 | 5742 | 41 |
| 2002 | 1565 | 1009 | 569 | 386 | 1390 | 965 | 3524 | 2360 | 5784 | 41 |
| 2003 | 1603 | 1021 | 545 | 409 | 1445 | 1027 | 3593 | 2457 | 6050 | 41 |
| 2004 | 1648 | 1065 | 619 | 478 | 1448 | 1073 | 3715 | 2616 | 6331 | 41 |
| 2005 | 1827 | 1178 | 746 | 557 | 1688 | 1311 | 4261 | 3046 | 7307 | 42 |
| 2006 | 1796 | 1176 | 820 | 586 | 1711 | 1336 | 4327 | 3098 | 7425 | 42 |
Table 5d: Proportions of women among those applying, receiving offers, being admitted, and in the resident population of Graduate Students (last ten years with 1988 for comparison)
| Year | Applying | Offers of admission | Admitted | In residence |
| 1988 | 26% | 29% | 29% | 28% |
| 1997 | 37% | 38% | 39% | 37% |
| 1998 | 38% | 35% | 39% | 38% |
| 1999 | 37% | 39% | 43% | 39% |
| 2000 | 39% | 40% | 42% | 40% |
| 2001 | 40% | 41% | 42% | 37% |
| 2002 | 43% | 34% | 41% | 40% |
| 2003 | 41% | 39% | 42% | 41% |
| 2004 | 43% | 44% | 44% | 41% |
| 2005 | 43% | 43% | 43% | 41% |
| 2006 | 42% | 43% | 45% | 42% |
Table 5e: Distribution of Graduate Students by College, December 2006
| Home | EU | Overseas | Total | ||||||
| Men | Women | Men | Women | Men | Women | Men | Women | All | |
| Christ's College | 54 | 13 | 7 | 4 | 26 | 18 | 87 | 35 | 122 |
| Churchill College | 58 | 22 | 40 | 16 | 118 | 71 | 216 | 109 | 325 |
| Clare College | 79 | 65 | 19 | 19 | 36 | 23 | 134 | 107 | 241 |
| Clare Hall | 18 | 25 | 32 | 25 | 65 | 58 | 115 | 108 | 223 |
| Corpus Christi College | 45 | 46 | 25 | 14 | 33 | 24 | 103 | 84 | 187 |
| Darwin College | 145 | 135 | 67 | 61 | 147 | 95 | 359 | 291 | 650 |
| Downing College | 73 | 44 | 24 | 23 | 49 | 30 | 146 | 97 | 243 |
| Emmanuel College | 60 | 41 | 15 | 13 | 24 | 21 | 99 | 75 | 174 |
| Fitzwilliam College | 54 | 18 | 29 | 17 | 77 | 48 | 160 | 83 | 243 |
| Girton College | 45 | 29 | 27 | 8 | 62 | 36 | 134 | 73 | 207 |
| Gonville and Caius College | 90 | 38 | 23 | 17 | 32 | 27 | 145 | 82 | 227 |
| Homerton College | 33 | 17 | 15 | 11 | 34 | 25 | 82 | 53 | 135 |
| Hughes Hall | 61 | 31 | 47 | 26 | 124 | 75 | 232 | 132 | 364 |
| Jesus College | 85 | 50 | 26 | 17 | 51 | 31 | 162 | 98 | 260 |
| King's College | 73 | 48 | 17 | 14 | 46 | 37 | 136 | 99 | 235 |
| Lucy Cavendish College | - | 26 | - | 14 | - | 54 | 0 | 94 | 94 |
| Magdalene College | 60 | 24 | 18 | 7 | 45 | 26 | 123 | 57 | 180 |
| New Hall | - | 22 | - | 6 | - | 45 | 0 | 73 | 73 |
| Newnham College | - | 68 | - | 32 | - | 67 | 0 | 167 | 167 |
| Pembroke College | 58 | 40 | 24 | 16 | 51 | 24 | 133 | 80 | 213 |
| Peterhouse | 32 | 16 | 16 | 9 | 27 | 22 | 75 | 47 | 122 |
| Queens' College | 96 | 53 | 30 | 23 | 68 | 66 | 194 | 142 | 336 |
| Robinson College | 40 | 15 | 9 | 8 | 11 | 12 | 60 | 35 | 95 |
| St Catherine's College | 56 | 42 | 15 | 15 | 42 | 28 | 113 | 85 | 198 |
| St Edmund's College | 38 | 17 | 34 | 21 | 107 | 58 | 179 | 96 | 275 |
| St John's College | 75 | 39 | 51 | 38 | 77 | 63 | 203 | 140 | 343 |
| Selwyn College | 53 | 26 | 27 | 13 | 33 | 26 | 113 | 65 | 178 |
| Sidney Sussex College | 43 | 22 | 27 | 15 | 36 | 29 | 106 | 66 | 172 |
| Trinity College | 118 | 47 | 38 | 25 | 87 | 53 | 243 | 125 | 368 |
| Trinity Hall | 56 | 43 | 29 | 23 | 54 | 40 | 139 | 106 | 245 |
| Wolfson College | 98 | 54 | 89 | 36 | 149 | 104 | 336 | 194 | 530 |
| TOTAL FOR ALL COLLEGES | 1796 | 1176 | 820 | 586 | 1711 | 1336 | 4327 | 3098 | 7425 |
Table 6a: Submission of Ph.D. dissertations within four, five, and six years by cohorts starting in the academical year shown
| Dissertation submitted within | |||
| cohort start year | 4 years | 5 years | 6 years |
| 1993 | 68% | 83% | 87% |
| 1994 | 70% | 84% | 87% |
| 1995 | 73% | 84% | 88% |
| 1996 | 72% | 84% | 87% |
| 1997 | 70% | 83% | 88% |
| 1998 | 74% | 84% | 89% |
| 1999 | 70% | 85% | 90% |
| 2000 | 68% | 84% | 89% |
| 2001 | 69% | 82% | 87% |
| 2002 | 69% | 84% | |
These figures do not include candidates who withdrew within 12 months of starting.
Table 6b: Ph.D. four-year submission rates, men and women, by School
| Cohort commencing: | 2002 | 2001 | 2000 | 1999 | ||||||||
| School | Men | Women | Total | Men | Women | Total | Men | Women | Total | Men | Women | Total |
| Arts and Humanities | 64% | 41% | 53% | 64% | 64% | 64% | 72% | 63% | 67% | 68% | 34% | 51% |
| Humanities and Social Sciences | 57% | 49% | 54% | 47% | 42% | 45% | 47% | 49% | 48% | 62% | 55% | 59% |
| Physical Sciences | 78% | 65% | 74% | 81% | 84% | 82% | 73% | 72% | 73% | 81% | 73% | 79% |
| Technology | 62% | 64% | 63% | 63% | 72% | 65% | 62% | 67% | 67% | 65% | 57% | 64% |
| Biological Sciences | 75% | 74% | 75% | 80% | 77% | 79% | 80% | 79% | 80% | 83% | 85% | 84% |
| Clinical Medicine | 69% | 78% | 73% | 68% | 82% | 74% | 75% | 63% | 69% | 86% | 42% | 70% |
| University | 69% | 63% | 66% | 68% | 69% | 69% | 68% | 67% | 68% | 74% | 64% | 70% |
Figures do not include candidates who withdrew within 12 months of starting.
Table 7: Students approved for degrees by the Board
| M.Phil. | |||||||||||||||
| Ph.D. | M.Sc. | M.Litt. | (One-year) | (Two-year) | M.St. | All Degrees | |||||||||
| Men | Women | Men | Women | Men | Women | Men | Women | Men | Women | Men | Women | Men | Women | All | |
| 1997 | 556 | 236 | 7 | 2 | 2 | 2 | 462 | 338 | 3 | 2 | 1030 | 580 | 1610 | ||
| 1998 | 567 | 237 | 7 | 2 | 2 | 9 | 422 | 314 | 2 | 1 | 1000 | 563 | 1563 | ||
| 1999 | 519 | 294 | 6 | 2 | 0 | 1 | 448 | 364 | 0 | 0 | 973 | 661 | 1634 | ||
| 2000 | 526 | 277 | 7 | 4 | 2 | 4 | 451 | 407 | 0 | 0 | 986 | 692 | 1678 | ||
| 2001 | 541 | 289 | 4 | 2 | 1 | 3 | 448 | 397 | 0 | 0 | 994 | 691 | 1685 | ||
| 2002 | 538 | 355 | 2 | 2 | 0 | 2 | 481 | 451 | 0 | 0 | 1021 | 810 | 1831 | ||
| 2003 | 534 | 302 | 2 | 1 | 1 | 0 | 516 | 419 | 0 | 0 | 1053 | 722 | 1775 | ||
| 2004 | 534 | 365 | 5 | 4 | 4 | 0 | 551 | 475 | 0 | 9 | 1094 | 853 | 1947 | ||
| 2004/2005* | 514 | 362 | 5 | 2 | 3 | 0 | 632 | 509 | 0 | 8 | 42 | 26 | 1222 | 881 | 2103 |
| 2005/2006 | 623 | 382 | 2 | 1 | 1 | 0 | 637 | 593 | 6 | 4 | 52 | 40 | 1361 | 980 | 2341 |
| 2006/2007 | 602 | 363 | 2 | 3 | 3 | 0 | 641 | 585 | 4 | 2 | 70 | 46 | 1368 | 953 | 2321 |
*Figures up to 2004 are for a calendar year; the figure for the academical year 2004-05 includes awards made during the period October-December 2004, which therefore appear twice in this table.
Table 8: Candidates not approved for the qualification sought
| Ph.D. | ||||||||||||
| _____________________________________________________________ | M.Sc. or M.Litt. | M.Phil. | M.St. | |||||||||
| Approved for M.Sc./M.Litt. on original Dissertation | Approved for M.Sc./M.Litt. on revised Dissertation | Not approved for any degree | Not approved for any degree | Not approved | Not approved | |||||||
| Men | Women | Men | Women | Men | Women | Men | Women | Men | Women | Men | Women | |
| 1994 | 3 | 2 | 1 | - | - | - | - | - | 14 | 11 | n.d. | n.d. |
| 1995 | 5 | 1 | 3 | 1 | - | - | - | - | 13 | 6 | n.d. | n.d. |
| 1996 | 1 | 1 | 3 | 2 | - | - | 1 | - | 11 | 1 | n.d. | n.d. |
| 1997 | 1 | - | 2 | 1 | - | - | 1 | - | 9 | 8 | n.d. | n.d. |
| 1998 | 2 | 1 | 2 | 2 | 2 | - | - | - | 8 | 7 | n.d. | n.d. |
| 1999 | - | 2 | 1 | 1 | - | - | - | - | 8 | 2 | n.d. | n.d. |
| 2000 | 4 | 2 | 1 | - | - | - | - | - | 6 | 3 | n.d. | n.d. |
| 2001 | 1 | 1 | 2 | - | 1 | - | - | - | 8 | 4 | n.d. | n.d. |
| 2002 | 0 | 1 | 2 | 0 | 0 | 0 | 0 | 0 | 4 | 15 | n.d. | n.d. |
| 2003 | 0 | 0 | 1 | 0 | 0 | 0 | 0 | 0 | 14 | 7 | 1 | 2 |
| 2004-05 | 3 | 1 | 2 | 0 | 0 | 1 | 1 | 0 | 9 | 2 | 3 | 2 |
| 2005-06 | 1 | 0 | 0 | 0 | 0 | 0 | 0 | 0 | 4 | 6 | 2 | 1 |
| 2006-07 | 0 | 0 | 0 | 0 | 0 | 2 | 0 | 0 | 7 | 4 | 2 | 0 |
Copyright © 2008 The Chancellor, Masters and Scholars
of the University of Cambridge.
Comments should be sent to
webmaster@admin.cam.ac.uk